Multispectral imaging camera sensors on agricultural drones allow the farmer to manage crops, soil, fertilizing and irrigation more effectively.
There are huge benefits both to the farmer and to the wider environment by minimizing the use of sprays, fertilizers, wastage of water and at the same time increasing the yield from crops.
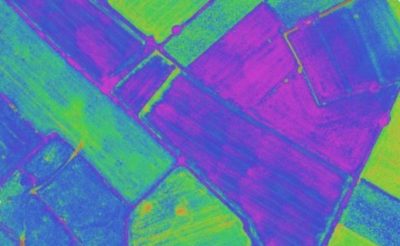
Multispectral camera remote sensing imaging technology use Green, Red, Red-Edge and Near Infrared wavebands to capture both visible and invisible images of crops and vegetation.
The multispectral images integrate with specialized agriculture software which output the information into meaningful data.
This land telemetry, soil and crop data allow the grower to monitor, plan and manage the farm more effectively saving time and money along with reducing the use of pesticides.
In this article, we explain the basics of multispectral imaging technology, reflectance, wavebands and vegetation indices such as NDVI and NDRE. All this information gives the farmer terrific insights into the health of the soil and plants.
We also show you the latest multispectral sensors for drones in farming, along with some terrific videos.
Multispectral Imaging Agriculture Drones
Benefits Of Multispectral Imaging
Multispectral images are a very effective tool for evaluating soil productivity and analyzing plant health. Viewing the health of soil and crops with the naked eye is very limited and is reactionary. Multispectral sensor technology allows the farmer to see further than the naked eye.
Data from multispectral imaging has the following benefits;
- Identify pests, disease and weeds. Optimize pesticide usage and crop sprays through early detection.
- Provide data on soil fertility and refine fertilization by detecting nutrient deficiencies. Help with land management and whether to take agriculture land in or out of production or rotate crops etc.
- Count plants and determine population or spacing issues.
- Estimate crop yield.
- Measure irrigation. Control crop irrigation by identifying areas where water stress is suspected. Then, make improvement to land areas such as install drainage systems and waterways based on the multispectral data.
- View damage to crops from farm machinery and make necessary repairs or replace problematic machinery.
- Survey fencing and farm buildings.
- Monitor livestock. Now, drones with thermal cameras can be used to locate livestock at night time along with plenty of other terrific uses.
Year Round Solution
What is terrific about multispectral imagery is that this sensor technology can be used throughout the crop cycle. Whether used during sowing, irrigation, fertilization or harvesting, drones providing multispectral imagery can be used at each step allowing the farmer to manage his crops very effectively in every season.
With multispectral advanced sensors and imaging capabilities, this gives farmers new ways to increase yields and reduce crop damage.
Multispectral Camera Remote Sensing Drones
Survey / Inspect / 3D Maps / Multispectral Imaging
 Before we delve further into the subject of multispectral imaging technology in farming, one of most basic tasks on any farm is to visibly inspect crops, fencing and buildings.
Top drones for this type of work need to have Global Positioning Satellite (GPS), First Person View (FPV), stabilized gimbals, excellent cameras and even autonomous waypoint navigation.
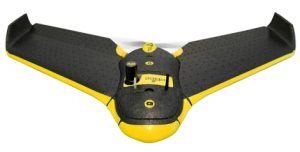
The drones listed below can be used to survey crops, fencing and buildings as they have terrific cameras mounted on the best stabilized gimbals. These drones can also build elevation models and photogrammetry maps using software such as Pix4D. They can also be adapted to carry multispectral sensors such as the Sequoia UAS sensor (see below).
- DJI Mavic Pro 2 / Zoom
- DJI Mavic 2 Enterprise
- DJI Phantom 4 Pro V2.0
- DJI Mavic Pro
- DJI Inspire 1
- SenseFly eBee
- DJI MG-1S
The DJI MG-1S was specifically designed for agriculture use. It can cover over 60 acres and uses GPS and vision sensors to follow the terrain allowing for the spraying of crops. The DJI MG-1S uses autonomous waypoint software to cover the spraying area. The DJI MG-1S will save farmers time and money.
The DJI Mavic 2 Enterprise, Inspire 1, Inspire 2 and DJI Phantom 4 can also be adapted for the FLIR Vue thermal sensor which can output terrific data used in precision farming especially in the area of irrigation management.
DJI Inspire 1 For Multispectral Imagery
One of the most innovative drones on the market to date and perfect for any farm is the DJI Inspire 1. This drone comes with excellent stabilization technology and a 4k camera. The Inspire 1 will give you perfectly clear video and images of your visual inspection around the farm.
The Inspire 1 has loads of intelligent flight modes including waypoints. Using Pix4D software along with waypoints, you can create 3D photogrammetry maps of your land.
The DJI Inspire 1 is very adaptable. The Zenmuse XT gimbal was designed specifically for the Inspire 1 to carry the FLIR Thermal camera. Also the latest Parrot Sequoia multispectral imaging sensing system can be added to the Inspire 1 making it the perfect drone for every farm.
Multispectral Imaging Technology
What Are Multispectral Images Answered
A multispectral image sensor captures image data at specific frequencies across the electromagnetic spectrum. The wavelengths may be separated by filters or by the use of instruments which are sensitive to particular wavelengths, including light from frequencies beyond our visible sight, such as infrared. Spectral imaging also allows for extraction of additional information which the human eye fails to capture.
Importance of Multispectral Images
The human eye is sensitive only to wavelengths between 400 and 700 nm, which is known as the visible spectrum. Humans can perceive a variety of colors ranging from violet to red. Wavelengths however can also be shorter (ultraviolet) or longer (infrared) than those of our visible eyesight.
Even though we cannot see them, these invisible wavebands are very indicative of the agronomic characteristics of soil, plants and crops.
Here an excellent video which explains a bit more on the subject of remote spectral sensing and mapping.
Multispectral Camera Imaging For Agriculture
Basics Of Multispectral Imagery
Every surface reflects back some of the light that it receives. Objects having different surface features reflect or absorb the sun’s radiation in different ways. The ratio of reflected light to incident light is known as reflectance and is expressed as a percentage.
Vegetation Indices
Vegetation reflectance properties are used to derive vegetation indices (VIs). The indices are used to analyze various ecologies. Vegetation Indices are constructed from reflectance measurements in two or more wavelengths to analyze specific characteristics of vegetation, such as total leaf area and water content.
Vegetation interacts with solar radiation differently from other natural materials, such as soils and water bodies. The absorption and reflection of solar radiation is the result of numerous interactions with different plant materials, which varies considerably by wavelength.
Water, pigments, nutrients, and carbon are each expressed in the reflected optical spectrum from 400 nm to 2500 nm, with often overlapping, but spectrally distinct, reflectance behaviors. These known signatures allow scientists to combine reflectance measurements at different wavelengths to enhance specific vegetation characteristics by defining VIs.
More than 150 vegetation indexes have been published in scientific literature, but only a small subset have substantial biophysical basis or have been systematically tested. The most popular vegetation index is NDVI (Normalized Difference Vegetation Index). NDRE (Normalized Difference Red Edge) is also quite common with Sentera’s single sensor having an optional NDRE filter.
NDVI Vegetation Index
 The Normalized Difference Vegetation Index (NDVI) is an index of plant “greenness” or photosynthetic activity, and is one of the most commonly used vegetation indices. Vegetation indices are based on the observation that different surfaces reflect different types of light differently.
Photosynthetically active vegetation, in particular, absorbs most of the red light which hits it while reflecting much of the near infrared light. Vegetation which is dead or stressed reflects more red light and less near infrared light. Likewise, non-vegetated surfaces have a much more even reflectance across the light spectrum.
By taking the ratio of red and near infrared bands from a remotely sensed image, an index of vegetation “greenness” can be defined. The Normalized Difference Vegetation Index (NDVI) is probably the most common of these ratio indices for vegetation. NDVI is calculated on a per-pixel basis as the normalized difference between the red and near infrared bands from an image.
NDVI can be calculated for any image which has a red and a near infrared band. The biophysical interpretation of NDVI is the fraction of absorbed photo-synthetically active radiation.
Various factors can affect NDVI values like plant photosynthetic activity, total plant cover, biomass, plant and soil moisture, and plant stress. Because of this, NDVI is correlated with both agricultural and ecosystem attributes, which are of interest to researchers and managers (e.g., net primary productivity, canopy cover, bare ground cover).
Also, because it is a ratio of two bands, NDVI helps compensate for differences both in illumination within an image due to slope and aspect, and differences between images due things like time of day or season when the images were acquired. Thus, vegetation indices like NDVI make it possible to compare images over time to look for agricultural and ecologically significant changes.
NDVI Crop Management Benefits
- Canopy coverage & density detection
- NDVI with time provides accurate growth trending
- Frost damage detection
- Large scale pest outbreaks
- Optimizing crop rotation duration
- Ecological benefits
- Vegetation dynamics or plant phenological changes over time
- Biomass production.
- Grazing impacts or attributes related to grazing management (e.g., stocking rates)
- Changes in rangeland conditions
- Vegetation or land cover classification
- Soil moisture
- Carbon sequestration or CO2 flux
NDRE Vegetation Index
The normalized difference red edge index (NDRE) is a metric which can be used to analyse whether images obtained from multi-spectral image sensors contain healthy vegetation or not. It is similar to Normalized Difference Vegetation Index (NDVI) but uses the ratio of Near-Infrared and the edge of Red.
NDRE uses a red edge filter to view the reflectance from the canopy of the crop. The red edge is a region in the red-NIR transition zone of vegetation reflectance spectrum and marks the boundary between absorption by chlorophyll in the red visible region and scattering due to leaf internal structure in the NIR region.
This allows the grower to determine all the different variables for crop management. Understanding the levels of chlorophyll can provide the farmer with the ability to monitor photosynthesis activity.
With NDRE information the grower can optimize harvest times based on transitions of photosynthesis activity. During crop harvest events like: hull split in almonds, or max sugar content in grapes, a noticeable change in NDRE values occur.
This change occurs because sugar molecules produced from photosynthesis are no longer needed in such a high demand since the fruit/nut has reached maturity. This information in invaluable as a crop management tool for harvest scheduling allowing the grower to have the highest quality produce.
Other factors that can change chlorophyll levels and cause crop stress are insect infestations. By utilizing NDRE you can determine how severe a mite outbreak is for an almond field and then use a precise way to terminate the infestation. This not only allows you to monitor outbreaks, but also reduce costs associated with pest control.
Multispectral Software Applications
Various precision farming and agricultural crop stress tools and applications are built around Vegetation Indexes to give a complete solution, which include processing, storage, presentation and analysis of multispectral data. More on the multispectral software applications below.
Also some of the best photogrammetry software can analyse NDVI and vegetation indexes. One example, is the DroneDeploy 3D mapping app.
Vegetation Spectrum
The reflectance properties of an object depend on the particular material and its physical and chemical state (e.g. moisture), the surface roughness as well as the geometric circumstances (e.g. incidence angle of the sunlight). The most important surface features are color, structure and surface texture. The perceived color of an object corresponds to the wavelength of the visible spectrum with the greatest reflectance.
These differences make it possible to identify different earth surface features or materials by analyzing their spectral reflectance patterns or spectral signatures. These signatures can be visualized in so called spectral reflectance curves as a function of wavelengths.
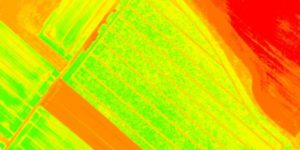
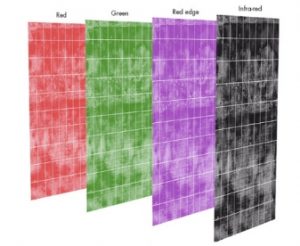
The below diagram show typical spectral reflectance curves of three basic types of Earth features: green vegetation, dry bare soil and clear water. Green, Red, and Infrared are the main ones used in agriculture. The Red Edge (short band corresponding to the Near Infrared entry point) is also sometimes used for obtaining additional indices.
The below vegetation spectrum image has details and explanations regarding the reflectance and vegetation wavebands.
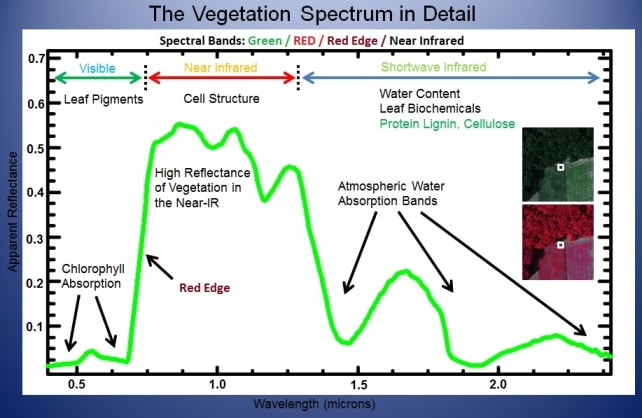
Vegetation Curve
The spectral reflectance curve of healthy green vegetation has a significant minimum of reflectance in the visible portion of the electromagnetic spectrum resulting from the pigments in plant leaves. Healthy vegetation will absorb in both the blue and red bands, giving rise to what is called the “green bump of healthy vegetation”.
Reflectance increases dramatically in the near infrared. Stressed vegetation can also be detected because stressed vegetation has a significantly lower reflectance in the infrared.
Soil Curve
The spectral reflectance curve of bare soil is considerably less variable. The reflectance curve is affected by moisture content, soil texture, surface roughness, presence of iron oxide and organic matter. These factors are less dominant than the absorbance features observed in vegetation reflectance spectra.
Water Curve
The water curve is characterized by a high absorption at near infrared wavelengths range and beyond. Because of this absorption property, water bodies as well as features containing water can easily be detected, located and delineated with remote sensing data. Turbid water has a higher reflectance in the visible region than clear water.
This is also true for waters containing high chlorophyll concentrations. These reflectance patterns are used to detect algae colonies.
Multispectral Vegetation Bands
 Green
Green
The Green corresponds to the reflected energy in the 500 to 600 nm spectral band and has the greatest reflectance of a plant in this band. The reflectance peak is at around 550 nm. It has been proven that this spectral band is strongly correlated with the amount of chlorophyll contained in the plant.
In this visible portion of the vegetation spectrum, the reflectance curve of a healthy plant exhibits the greatest reflectance in a green waveband (in the range of 550 nm). This is why plants appear green to us.
A chemical compound in leaves called chlorophyll strongly absorbs radiation in the red and blue wavelengths but reflects green wavelengths. Leaves appear “greenest” to us in the summer, when chlorophyll content is at its maximum.
In autumn, there is less chlorophyll in the leaves, so there is less absorption and proportionately more reflection of the red wavelengths, making the leaves appear red or yellow (yellow is a combination of red and green wavelengths).
The internal structure of healthy crops act as excellent diffuse reflectors of near-infrared wavelengths. Measuring and monitoring the near-IR reflectance is one way to determine how healthy (or unhealthy) vegetation may be.
Still most of the light in the visible spectrum reflected by a plant under stress is in the green range. Hence, to the naked eye, a plant under stress is indistinguishable from a healthy one. On the other hand, the difference can be seen in the reflectance of light in the infrared range, which is far less.
Red
Corresponds to the reflected energy in the 600 – 700 nm spectral band. The strong chlorophyll absorption in this band results in a low reflectance. Reflectance varies significantly in relation to factors such as biomass, LAI (Leaf Area Index), soil history, crop type, humidity and plant stress.
For most crops this band gives an excellent contrast between the plants and the soil and it is extensively used for compiling most of the vegetation indices in agriculture.
Red Edge
This a very narrow band (700 – 730 nm), which corresponds to the entry point of Near Infrared. It is the point of sudden change in reflectance, from strong absorption of Red to substantial reflection of Near Infrared. This band is very sensitive to plant stress and provides information on the chlorophyll.
- Crop health analysis
- Plant counting
- Water management
NIR (Near-Infrared)
Corresponds to the wavelengths in the 700 nm to 1.3 µm range, has the strongest reflectance of the bands studied. There is a very strong correlation between this reflectance and the level of chlorophyll in the plant. A highly significant variation of the reflectance in this band is produced when a plant is under stress.
Along with the Red spectral band, infrared is extensively used for compiling most of the vegetation indices in agriculture
NIR is sensitive to the leaf cellular structure and provides critical data to monitor changes in crop health.
- Soil property and moisture analysis
- Crop health and stress analysis
- Water management
- Erosion analysis
- Plant counting
Healthy vegetation absorbs blue and red-light energy to fuel photosynthesis and create chlorophyll. A plant with more chlorophyll will reflect more near-infrared energy than an unhealthy plant. Thus, analyzing a plants spectrum of both absorption and reflection in visible and in infrared wavelengths can provide information about the plants’ health and productivity.
Thermal Infrared
Thermal infrared radiation is the part of electromagnetic spectrum which has a wavelength of between 3.0 and 20 micrometers. Most remote sensing applications make use of the 8 to 13 micrometer range. The main difference between thermal infrared and the infrared (color infrared – CIR) is that thermal infrared is emitted energy that is sensed digitally, whereas the near infrared (also called the photographic infrared) is reflected energy.
Drones with thermal vision cameras has been growing fast and playing an important role in various fields of agriculture such as;
- Nursery monitoring
- Plant physiology analysis
- Irrigation scheduling
- Soil salinity stress detection
- Plant disease detection
- Maturity evaluation
- Bruise detection of fruits
- Yield forecasting
ToF 3D Depth Camera Sensors
In addition to Multispectral sensors for agriculture, Time-of-Flight 3D Cameras can help to improve the data and provide extra data in 2 ways;
- ToF camera sensors can be used as a high precision reactive altimeters giving extra flight stability to the drone while capturing Multispectral images.
- ToF 3D depth technology is excellent for measuring volumes. These camera sensors can be used to measure stockpiles like compost, manure and mulch.
RGB (Red/Green/Blue)
Visible light is defined as having wavelengths in the range of 400 to 700 nm. In agriculture, a quality drone with an excellent gimbal and camera can be used for visual farm inspections, elevation modeling and even plant counting.
This video gives further detail on multispectral mapping.
Multispectral Camera Sensors For Agriculture
Let’s take a look now at some of the latest multispectral imaging remote sensors, the necessary software to analyse, process and output the data and the compatible drones in which the sensor is mounted.
Sentera – 3 Multispectral Sensors For Drones
Sentera multispectral drone sensors deliver exceptional performance and are very competitive in price, quality and function. Sentera have 3 multispectral sensors for drones which are for agriculture. These sensors also can be mounted onto DJI drones including the DJI Mavic, Phantom 3, Phantom 4 and Inspire models.
Their sensors produce context rich color and near-infrared (NIR) image data to deliver top NDVI data to growers.
Sentera High Precision NDVI & NDRE Single Sensor: The Sensor integrates onto a multitude of drone platforms, enabling any grower to quickly and affordably access critical, precise TrueNDVI™ crop data.
The High-Precision Single sensor is available in two variants: normalized difference vegetation index (NDVI) and normalized difference red edge (NDRE), the Sentera High Precision Single Sensor filters effectively reject out-of-band leakage before it can contaminate the measurement and lead to index errors.
These advanced sensors make it easier for users to integrate satellite-based index data with drone-based index data. Utilizing high precision filters, you are provided with invaluable NDVI or NDRE information about crop health, maturity, and vigor.
Ad: Check out this superb DJI Mavic 2 Pro deal on Amazon.
The sensors produces crisp, detailed RGB imagery or near-infrared (NIR) imagery, allowing growers to quickly produce normalized difference vegetation index (NDVI) crop maps. The level of detailed information provides users with invaluable information about crop health and maturity.
- Easily integrates into virtually any system, including several DJI drone platforms.
- Effectively collects only the precise bands needed for accurate NDVI and NDRE measurements.
- Low-distortion optics + global shutter technology ensure crisp, clear crop imagery.
- Captures data to create precise NDVI maps, providing users with a complete crop health report card.
- Helps customize application of fertilizer, pesticides and herbicides base on data-drive information.
- Seamless data flow into AgVault software allows imagery to be viewed at the field edge and immediate action to be taken.
 Sentera Quad: This is the lightest in weight, most compact and highest performance multispectral sensor available for drones today.
This advanced sensor has the capacity to recognize six specific bands of light, as well as measure full-spectrum RGB to generate true color imagery. The Quad Sensor provides deeper insights about crop health and vigor to the agriculture industry.
- Saves time by capturing full-spectrum RGB imagery and comprehensive red edge data in a single flight.
- Enables customized application of fertilizer, pesticides and herbicides, based on data-driven information.
- Facilitates the spotting and diagnosing of growth issues.
- Compatible with AgVault™ so data can be organized, stored, viewed and shared with a team.
Sentera Double 4k Sensor: This agriculture Sensor is the smallest and lightest dual sensor available today. It is also compatible with any drone. The Double 4k captures 12 megapixel high resolution images and features an enhanced processor which expedites delivery of precise crop health images to popular stitching tools, including Pix4D and Agisoft.
With increased image resolution and augmented processor speed, users will completely satisfied with the crisp crop maps, with improved shape files and stitching.
- Live streams NDVI video to mobile device via LiveNDVI™ technology
- Simultaneously captures 12 megapixel NDVI and high-resolution RGB imagery
- Expedites imagery download utilizing enhanced processor
- Instantly download images via WiFi or wired connection
- Easily modified to advance with industry technologies
- Capable of 4k ultra-high-definition video capture
- Seamlessly integrates with AgVault™ Software
Parrot Sequoia Multispectral Sensor
The Parrot Sequoia is one of the smallest and lightest multispectral UAS remote sensors on the market to date. It captures images of crops across the four highly defined, visible and non-visible spectral bands, plus RGB imagery. This solution uses two sensors.
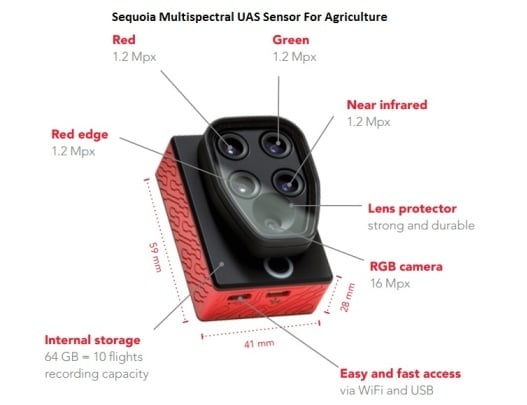 The second sensor is the sunshine Sensor and is mounted on the back of the drone. During the flight the sunshine sensor will continuously sense and record the light conditions in the same spectral bands as the multispectral sensor. The light data thus collected allows the values of the identified spectral signatures to be confirmed.
The Sequoia sensor has its own GPS, IMU and magnetometer so it does not rely on the drone for this positional data. It is perhaps the best multispectral sensor on the market to date. Some of its benefits are as follows;
- Identify problem areas in a field that need attention and further scouting
- Refine fertilization by detecting nutrient deficiencies symptoms
- Optimize pesticide input through early detection of biotic stress
- Control crop irrigation by identifying areas where water stress is suspected
- Estimate crop yield by processing and exploiting agronomic indices
Sequoia Sensor Compatible Drones
The Sequoia multispectral remote sensing system is fully compatible with the following drones:
- SenseFly eBee Ag
- DJI Mavic 2 Pro
- DJI Phantom 4
- DJI Inspire 1
- Yuneec Typhoon H
Tetracam’s ADC Lite Sensor
The ADC Lite from Tetracam is a lightweight (7 ounce) multispectral remote sensing system which it as an ideal solution for unmanned aerial vehicles. The ADC Lite contains a single 3.2 megapixel sensor optimized for capture of visible light wavelengths longer than 520 nm and near-infrared wavelengths up to 920 nm.
Tetracam Multispectral Software
PixelWrench2: is the image processing software included with the multispectral camera and enables extraction of standard vegetation indices (such as NDVI, SAVI, canopy segmentation and NIR/Green ratios) from the captured images.
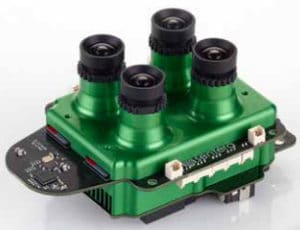
MicaSense RedEdge Sensor
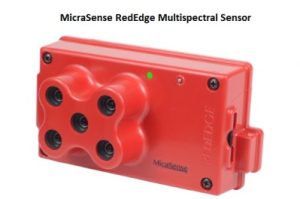 RedEdge multispectral sensing system simultaneously captures five discrete spectral bands, enabling the creation of tailored indices for customized applications.
Global shutter design creates distortion-free images on every platform. A variety of interface options including stand-alone mode, serial, Ethernet, and WiFi, give RedEdge integrators expanded flexibility.
RedEdge’s Downwelling Light Sensor (DLS) enables measurement of ambient light conditions during flight for more accurate data in varying light conditions.
RedEdge Drones
RedEdge is ready for integration with any drone. It comes with flexible interfaces including Ethernet, serial, and PWM/GPIO trigger,
MicraSense is the best software solution to analyse data from the RedEdge multispectral sensor. See below for more detail on MicraSense.
Airinov multiSPEC 4C Agronomic Sensor
Here are the main features of the Aironov multispectral image remote sensing system for precision agriculture.
- The multiSPEC 4C sensor measures reflected light from crops in the four different spectral bands: green, red, red edge and NIR
- 10 view points of the same sort to improve accuracy
- Correction of reflectance signal for absolute precision
- Integrated lux meter measures light intensity and color
- The sensor also records the geological position and date of every picture
- Wide angle lens enables high speed mapping thanks to large overlap
- Typical ground resolution of 5 to 15 cm
- Global shutter provides clear, distortion free images even in windy conditions
- Can be adapted to any drone
Multispectral Imaging Companies
Pix4DMappter AG: This software allows you to take multispectral images and convert them into accurate index maps, like NDVI and orthomosaics of your fields, giving you vital information for quick response, better yield and operational efficiency.
MicaSense: provide a complete solution for processing, storage, presentation and analysis of multispectral data. They deliver technologies which cost-effectively gather crop health information without waiting for satellite passes or paying the high costs of manned-aircraft flights.
Imagery can be collected at resolutions measured in just inches per pixel. Data captured on a frequent basis enables growers and agronomists to map the health and vigor of crops today as well as observe changes in crop health over time.
Airinov: provide drone based remote sensing solutions for precision farming. They help agriculture professionals to turn their multispectral imagery and data into a real farm management tool. Parrot Airinov support the farmer from the first steps of flight logistics, through to agronomy interpretation and up to the final integration of the map into a tractor guiding system.
To finish this article, I leave you with a look at the fantastic Parrot Sequoia multispectral imaging sensor and how it is changing the way in which we manage farms.